In my last post Data Mining: 4 Ways to Use Patent Analysis for Any Size Business, I described some benefits of patent analytics using 2-D data, but let’s look into the data rich information that can be derived from adding dimensions. (Don’t forget, patent analytics isn’t intended to be used in isolation from other resources.)
Map opportunities and threats in your market space
This example uses a bubble chart to plot the amount of activity occurring at companies trying to obtain patents for certain technologies. Using this format, we are able to start visualizing a map of opportunities and threats.
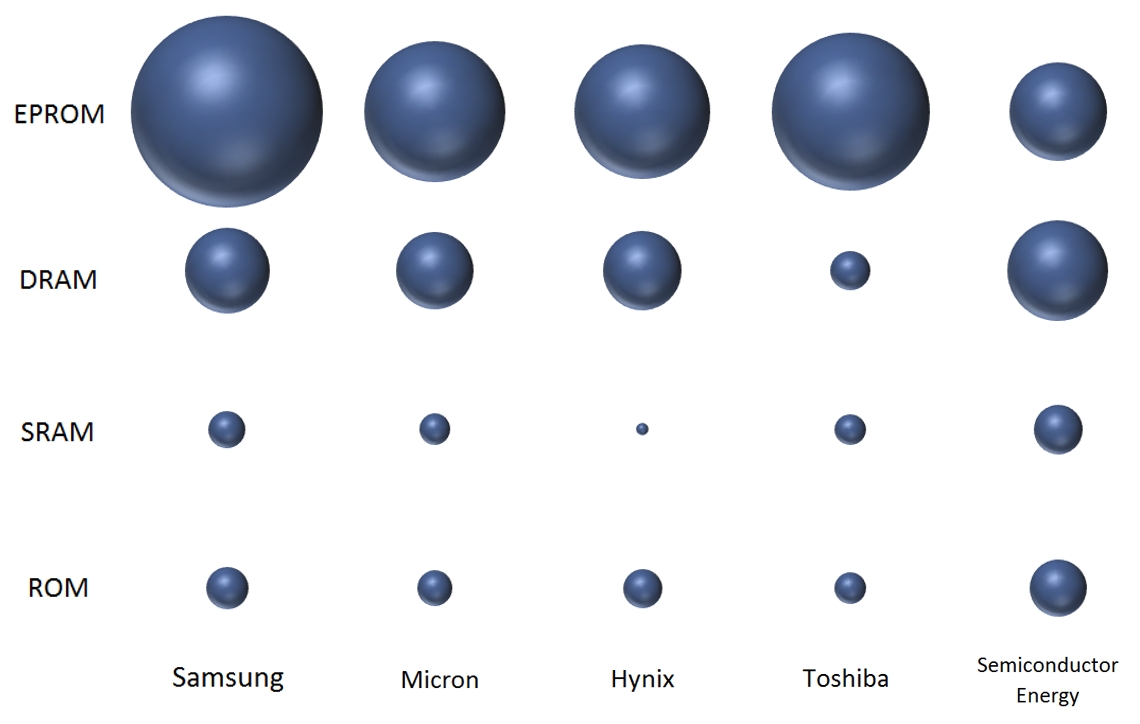

This is a good time to mention that Patent Analytics reminds us to consider the three legs of the stool when making business decisions since patent applications covering a specific technology are filed in an attempt to capture a future market. The above data is helpful but it is only a portion of the information to be analyzed as we’re considering our future activities or entrance into this area.
Technology scouting
Did you read the post Has the Technology Life Cycle thrown you a curve? that included this graphic? [1]
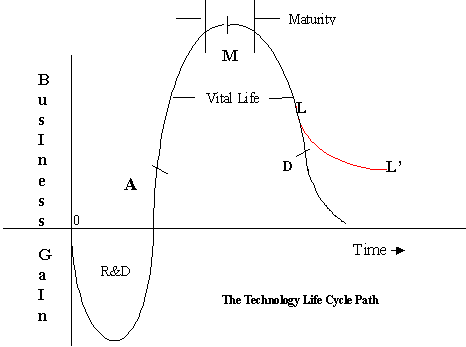
If so, you understood that this graphic related to the money a company invested into a new technology from ideation to when sales end.
If we translate the technology life cycle curve into one appropriate for intellectual property, we could say that increasing numbers of patent applications represent increasing recognition of opportunities in a particular technology and its future markets. As the number of applications flattens and starts decreasing, we could say that the opportunities are recognized as diminishing. The shape best representing this description would be more like the technology life cycle curve [2] shown here:
In the next chart, the overall height of the individual lines represents the number of IP publications being filed in a particular technology space.
For example, the blue color on the bottom represents one specific technology.
This technology was generally stable from the earliest time (on the left) until it starts to decline to a new level around 2008.
Excluding any other information, we can say that the blue technology may have reached a level of technical maturity as fewer applicants are finding opportunities for improvement and/or in anticipating a future return on their investment. The red and green technologies may have a similar situation.
The technology that may not be following a downward level of attention is represented in purple. At best, it may be stable since the activity level is similar to that seven to eight years ago.
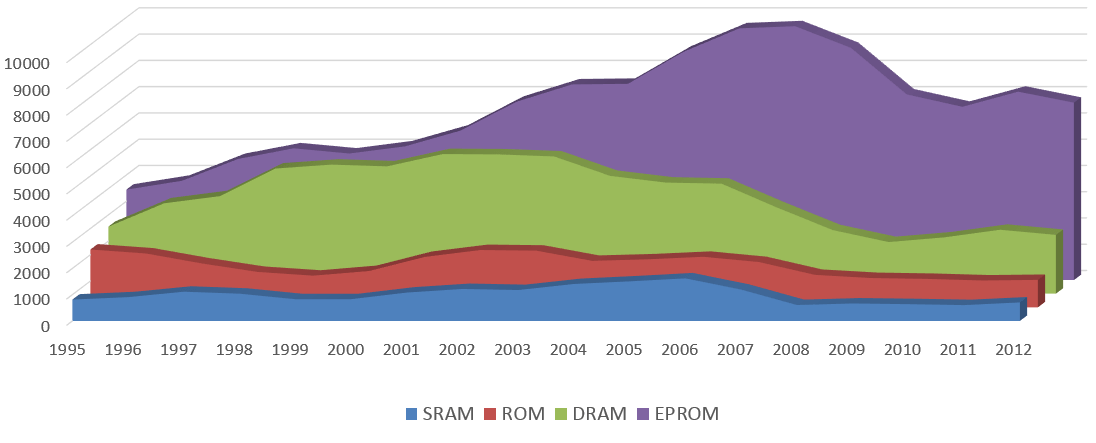
Knowing these levels of activity are also important for those considering a merger, acquisition or investment since patents, depending upon the context, can help identify future industry growth or decline. If nothing else, they help provide some clues about the value of intellectual property in this area.
Pick Apart Your Competition
Finally, let’s use patent analytics to learn more about specific companies which may be our competitors. By looking at these activity numbers, we can surmise the levels of investment, research and future markets being sought out by competitors. Since Samsung had the largest share of data, we’ll pick on them for our next example. Sorry Samsung!
If we have some predisposition of specific technologies, we can jump straight into analyzing the levels of activity on those areas such as that shown in the following graph.
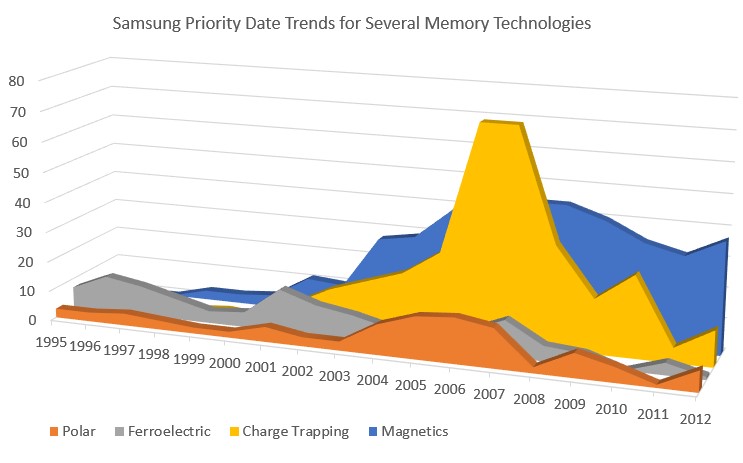
We can surmise that Samsung invested, researched and saw more opportunities in Charge Trapping memories during 2006 to 2007 but this has gradually waned to the increasing attention being paid to magnetic memories.
Let’s do a quick wrap-up of the value of Patent Analytics:
- Helps identify new competitors, technology maturity, risks and opportunities.
- Brings together the relationship between technology, IP and markets.
- Ensures that our view of the future is verifiable with data.
- Is a tremendous value since it brings lots of real data points into focus both quickly and at a reasonable cost since it eliminates or minimizing the tedious process of reading lots of patents or patent applications.
- It helps identify trends quickly.
- Can be used on many business segments (not just high-technologies such as memory used in above). Examples include the music industry, grocery chains and so many more industries.
- It should not be used to the exclusion of other data.
But, be cautious about your expectations, because Patent Analytics can raise more questions than answers (often a good thing).
And, finally, I will say it again. Patent Analytics Is a tremendous resource but should not be used to the exclusion of other data.
Do you have questions about this information or what other models can be created with Patent Analytics? Contact me or submit a comment.
Graphics credits:
[1] Krantzmh (Wikimedia)
[2] Craig Chelius (Wikimedia)


Leave a Comment